
Data-driven insights during a public health crisis
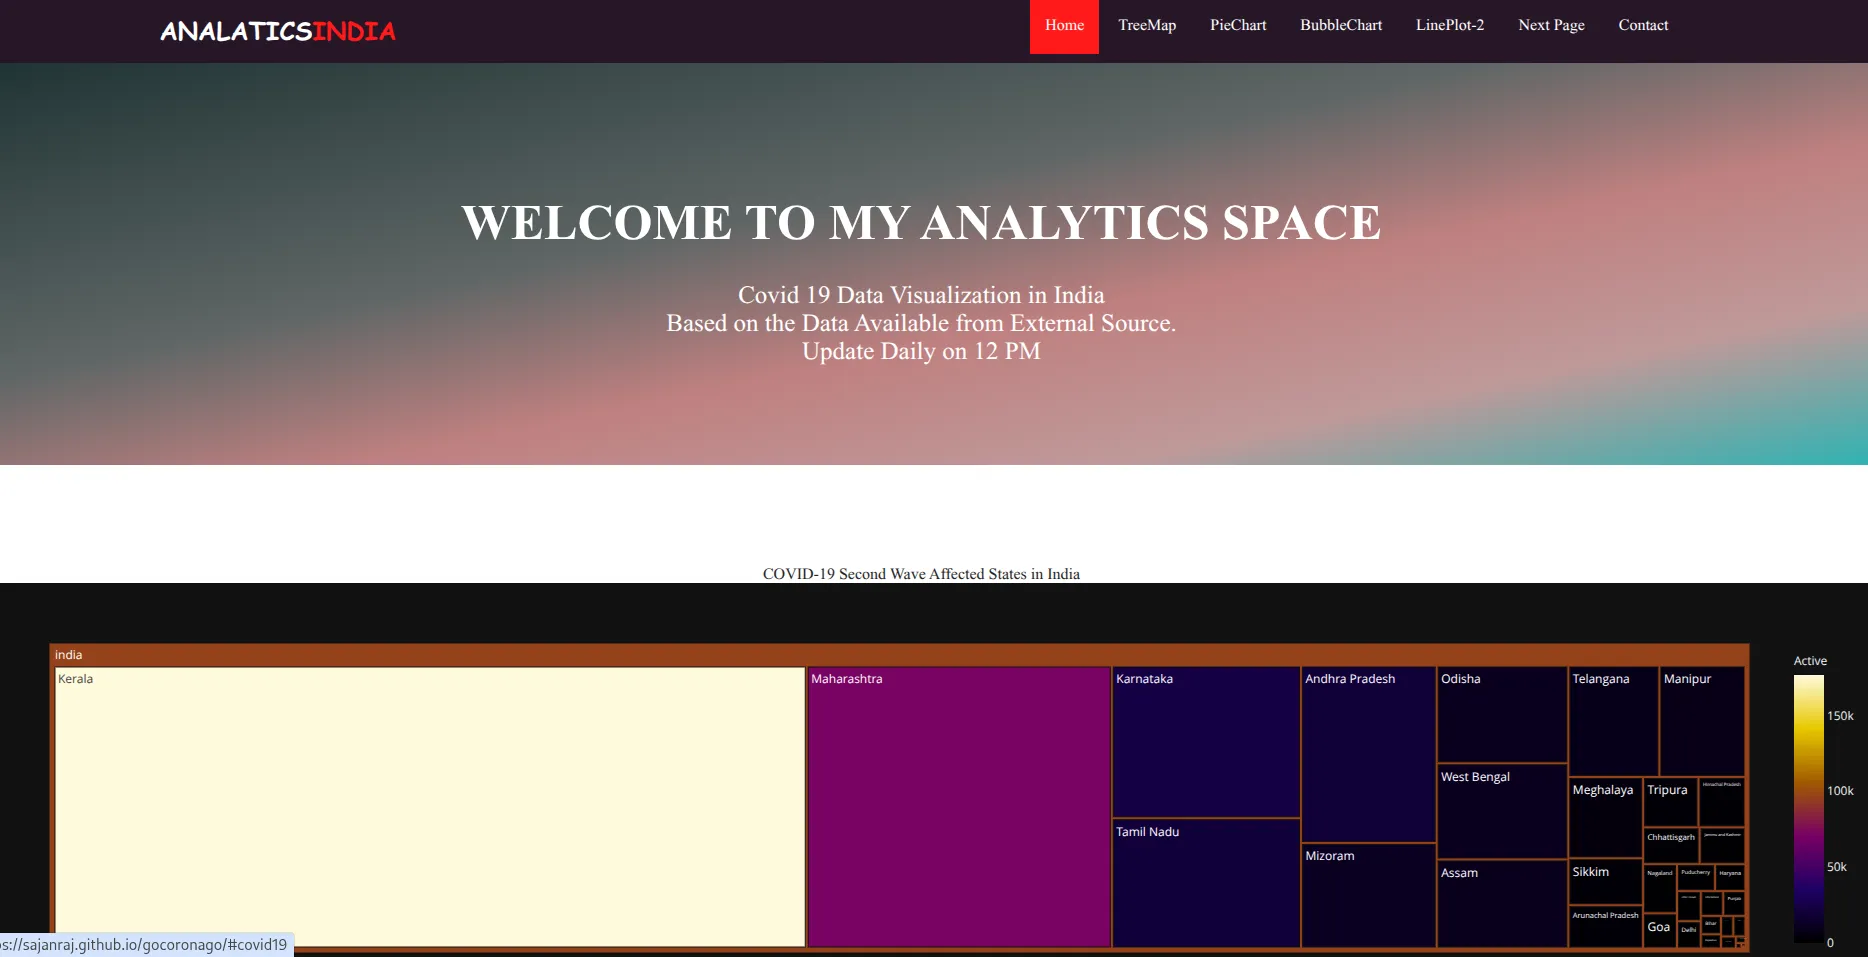
In the wake of the global pandemic, this project focused on extracting critical insights from India’s COVID-19 datasets. By applying rigorous data analysis and visualization techniques, we sought to provide a clear, evidence-based understanding of the virus’s trajectory across the nation.
“In a crisis, data is our most valuable navigator. Without it, we are sailing blind.”
The COVID-19 pandemic generated an unprecedented volume of data, but often in formats that were difficult for the general public to interpret. The challenge was to filter the noise, identify meaningful trends in infection and recovery rates, and visualize regional variations to support public awareness and healthcare planning.
Using a Python-based analytical stack, we developed a pipeline to process time-series data and generate high-impact visualizations.
This project reinforced the critical importance of responsible data communication. It demonstrated that analytics is not just about numbers, but about providing clarity and direction during times of uncertainty. The resulting insights helped demystify the pandemic’s progression for a wider audience.